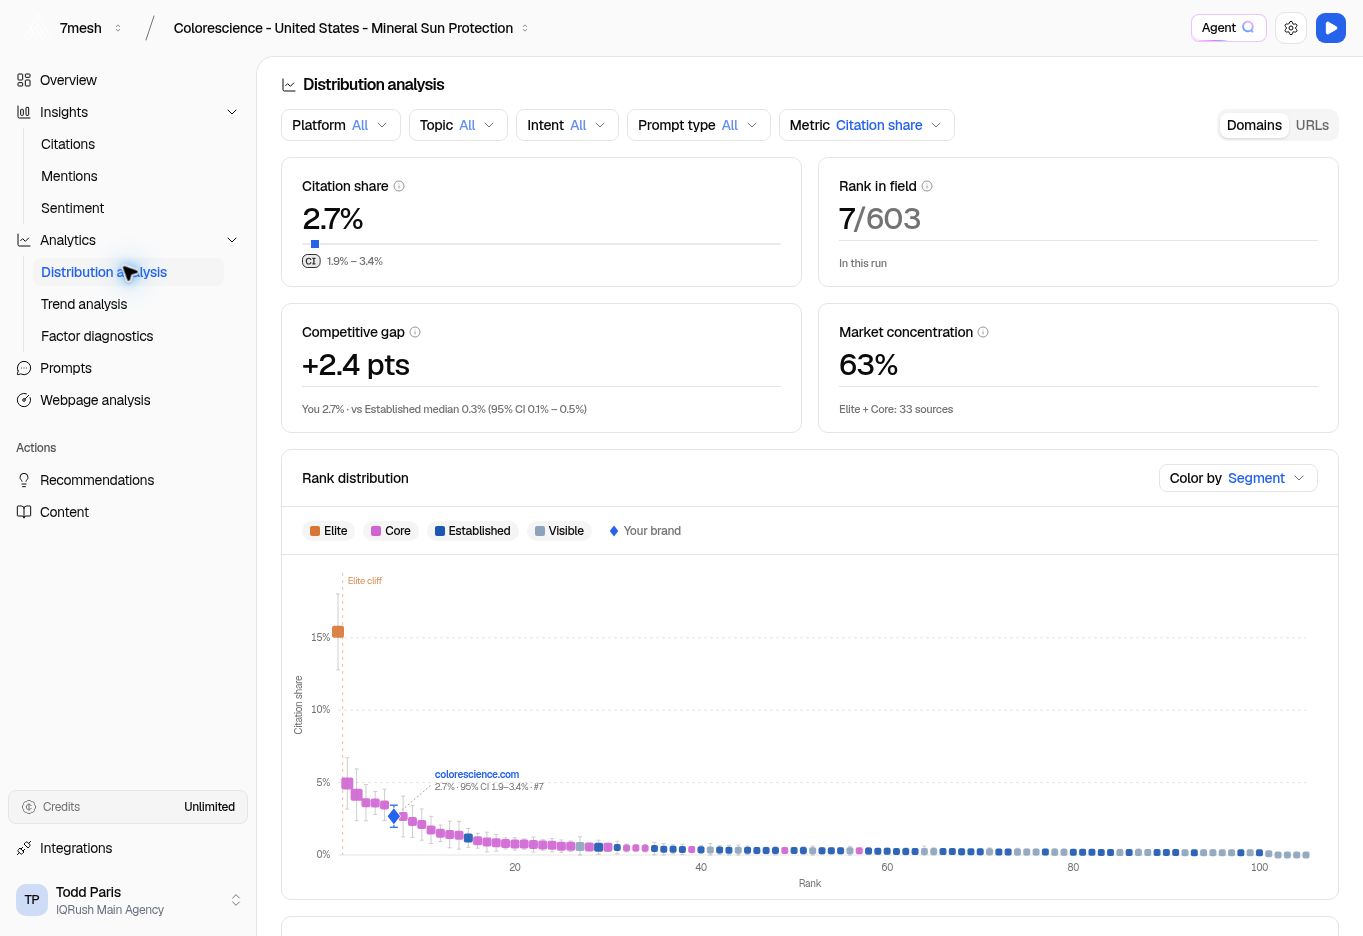
Open Analytics → Distribution analysis to see your position in one run. Citation metrics compare websites or pages; Mention coverage compares mentioned entities.
Distribution analysis with citation share, rank, competitive gap, and the rank chart.

The diamond marks your brand in the rank distribution. The cards describe the selected run and metric.

Set the comparison

  1. Check the run selected in Runs.
  2. Set Platform, Topic, Intent, and Prompt type as needed.
  3. Choose a Metric.
  4. Choose Domains to compare websites or URLs to compare individual pages, where available.
Some measures do not support both views. A disabled option does not mean data has been lost; use the scope available for that measure.

Read the cards

Read the comparison label under Competitive gap. It may refer to a group median rather than the top competitor or the entire market.

Explore the ranking

Use Color by to change how the chart groups sources. The legend controls let you show or hide the displayed segments. Your brand is marked separately. Below the chart, the leaderboard gives you a row-by-row view. Use Search by source, sorting, and page controls to find a website. Review its metric and interval together. The labels Elite, Core, Established, and Visible describe groups in the displayed source distribution. They are not grades for your business or your writing.

Keep the conclusion specific

A rank describes this run, its metric, and its filters. Check Results stability in Citations before treating the source ordering as settled, then read each metric’s confidence interval. Close ranks do not automatically establish a clear difference. A change in rank alone does not tell you whether the underlying result changed meaningfully. Use Trend analysis when the question is about movement over time. Next: Compare runs.