> ## Documentation Index
> Fetch the complete documentation index at: https://docs.iqrush.ai/llms.txt
> Use this file to discover all available pages before exploring further.
# Find where your results are stronger or weaker
> Open Analytics → Factor diagnostics when an overall result leaves you asking, “Where should we look more closely?”
Open **Analytics → Factor diagnostics** when an overall result leaves you asking, “Where should we look more closely?”
This page breaks the selected result into contexts such as AI platform, topic, intent, and prompt type.
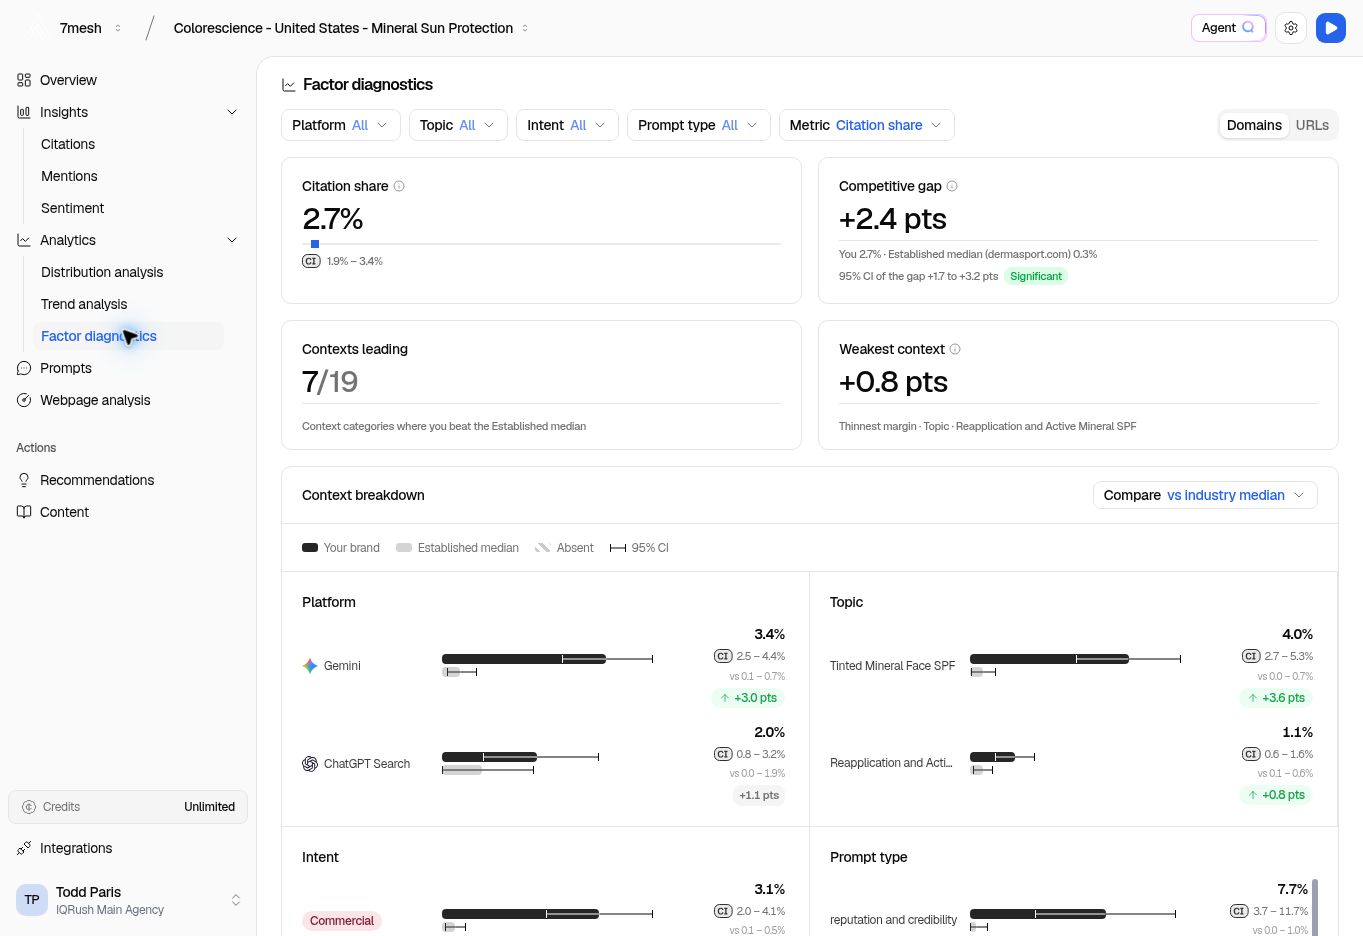 ## Choose the comparison
1. Set **Platform**, **Topic**, **Intent**, and **Prompt type** if you want to narrow the result.
2. Choose **Metric**.
3. Choose **Domains** or **URLs** when the selected metric supports it.
4. In **Context breakdown**, set **Compare**.
5. If you choose a competitor or a previous run, select the available competitor or reference run.
The comparison choices depend on the data available. A first run has no earlier run to compare with. If the page substitutes an available comparison, read the message and the displayed benchmark before continuing.
## Read the cards and rows
**Competitive gap** shows the difference from the named comparison, in percentage points. **Contexts leading** summarizes the contexts in which your brand leads that comparison. **Weakest context** identifies the weakest of the statistically distinguishable differences available in the breakdown; if you lead throughout, it can be your thinnest lead.
“Weakest” does not necessarily mean below the comparison. In the Colorescience screenshot, the weakest context still has a positive gap.
Look at the bars, confidence intervals, and assessments for each context. A large-looking gap with a wide interval may still be too uncertain to act on. The overall gap and the individual context indicators can apply different assessments, so read the explanation attached to each rather than assuming every indicator should agree.
Narrow filters leave fewer observations to work with. An overall **Converged** result does not automatically make every small subgroup decision-grade.
## Choose a follow-up
If one topic is weaker, open Citations or Mentions and apply that topic filter. Read the evidence, then look for a relevant recommendation.
If the difference is mainly between platforms, compare the sources and answers on those platforms before changing your content.
Factor diagnostics identifies patterns in the results. It does not, by itself, explain what caused those patterns.
## Ask for another perspective
“Compare our visibility by the topics and audience profiles available in this project. Identify gaps in the data.”
Use Agent Q or connected ChatGPT or Claude. First confirm which profiles and dimensions the measurement includes. See more [questions and reports](/guides/31-questions-and-reports).
**Next:** [Inspect the cited pages](/guides/13-webpage-analysis) or [choose work to do](/guides/14-choose-recommendations).
This documentation is built and hosted on [Mintlify](https://mintlify.com), a developer documentation platform.
## Choose the comparison
1. Set **Platform**, **Topic**, **Intent**, and **Prompt type** if you want to narrow the result.
2. Choose **Metric**.
3. Choose **Domains** or **URLs** when the selected metric supports it.
4. In **Context breakdown**, set **Compare**.
5. If you choose a competitor or a previous run, select the available competitor or reference run.
The comparison choices depend on the data available. A first run has no earlier run to compare with. If the page substitutes an available comparison, read the message and the displayed benchmark before continuing.
## Read the cards and rows
**Competitive gap** shows the difference from the named comparison, in percentage points. **Contexts leading** summarizes the contexts in which your brand leads that comparison. **Weakest context** identifies the weakest of the statistically distinguishable differences available in the breakdown; if you lead throughout, it can be your thinnest lead.
“Weakest” does not necessarily mean below the comparison. In the Colorescience screenshot, the weakest context still has a positive gap.
Look at the bars, confidence intervals, and assessments for each context. A large-looking gap with a wide interval may still be too uncertain to act on. The overall gap and the individual context indicators can apply different assessments, so read the explanation attached to each rather than assuming every indicator should agree.
Narrow filters leave fewer observations to work with. An overall **Converged** result does not automatically make every small subgroup decision-grade.
## Choose a follow-up
If one topic is weaker, open Citations or Mentions and apply that topic filter. Read the evidence, then look for a relevant recommendation.
If the difference is mainly between platforms, compare the sources and answers on those platforms before changing your content.
Factor diagnostics identifies patterns in the results. It does not, by itself, explain what caused those patterns.
## Ask for another perspective
“Compare our visibility by the topics and audience profiles available in this project. Identify gaps in the data.”
Use Agent Q or connected ChatGPT or Claude. First confirm which profiles and dimensions the measurement includes. See more [questions and reports](/guides/31-questions-and-reports).
**Next:** [Inspect the cited pages](/guides/13-webpage-analysis) or [choose work to do](/guides/14-choose-recommendations).
This documentation is built and hosted on [Mintlify](https://mintlify.com), a developer documentation platform.