> ## Documentation Index
> Fetch the complete documentation index at: https://docs.iqrush.ai/llms.txt
> Use this file to discover all available pages before exploring further.
# See what changed between runs
> Open Analytics → Trend analysis after at least two runs have completed.
Open **Analytics → Trend analysis** after at least two runs have completed. Use it to separate a visible numerical change from a change the measurement supports more clearly.
 ## Compare the same thing
1. Select the run you want to review in **Runs**.
2. Set **Platform**, **Topic**, **Intent**, and **Prompt type**.
3. Select the **Metric** and, where available, **Domains** or **URLs**.
4. Check the comparison dates shown on the page.
5. In **Run comparison**, use **Reference** to choose the run you want to compare against.
Keep the metric, filters, and project scope consistent when discussing a change with someone else. Check the dates printed above the headline cards separately from the **Reference** selected for **Run comparison**; the reference selector controls its comparison and the movers, rather than resetting the whole history chart.
Before drawing a strong conclusion, check the relevant runs’ **Results stability** in Citations. A comparison between completed runs still needs enough evidence and precision for the decision you intend to make.
## Read the result
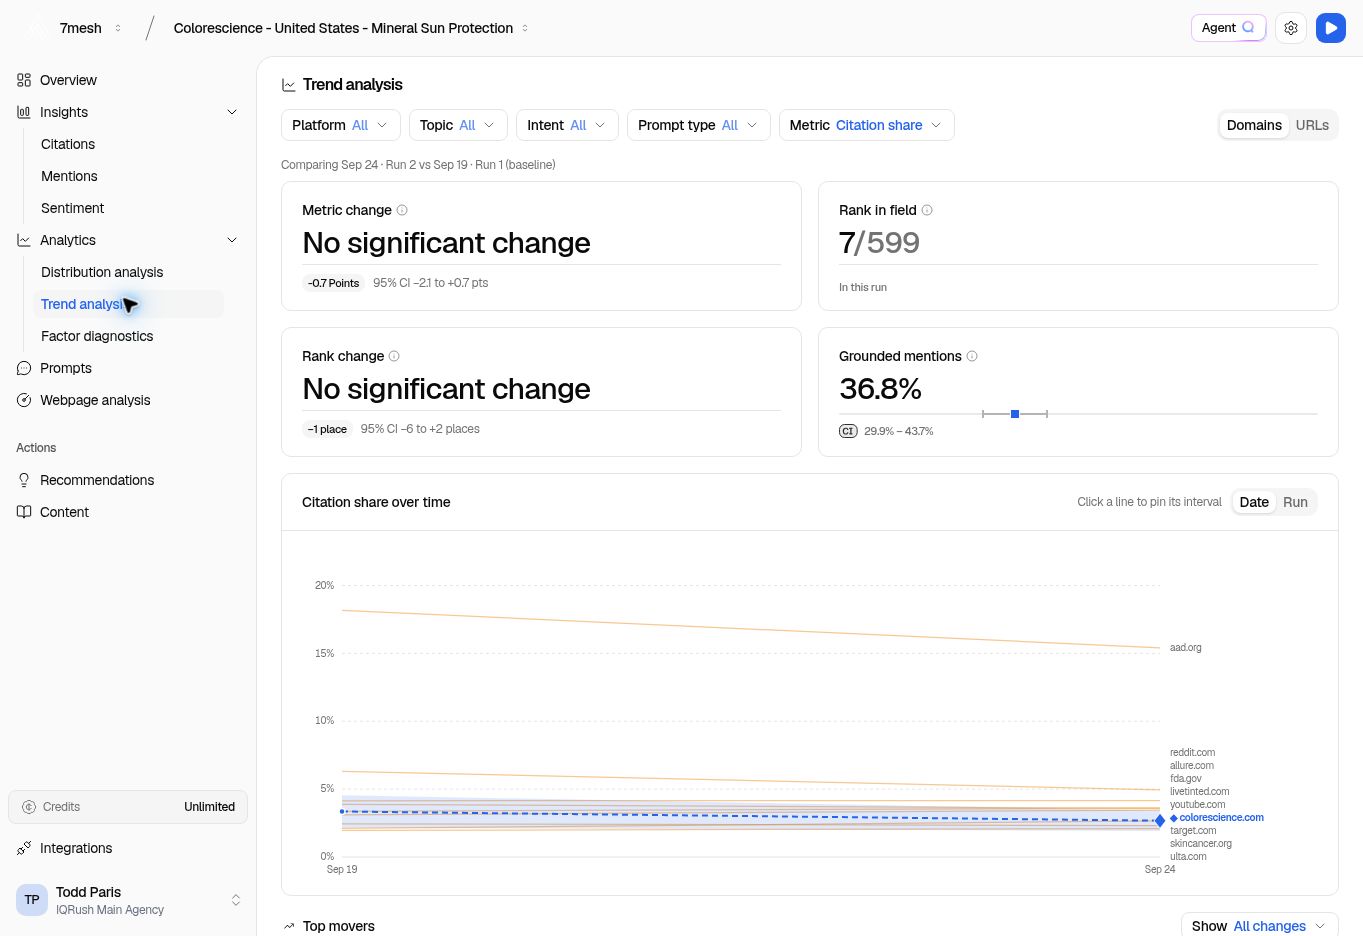
The **Metric change** card shows the difference and an assessment such as **No significant change**. A minus sign does not automatically mean a meaningful decline, just as a plus sign does not automatically mean a meaningful gain.
For example, the Colorescience screenshot shows a small decrease in citation share alongside **No significant change**. The measured decrease is not established as a clear change beyond uncertainty in that comparison. This does not prove the result stayed exactly the same.
**Confidence intervals are essential to this judgment.** AI answers vary, so the difference between two point estimates can be noise. Read the **95% CI** on the change where shown, together with the page’s assessment. A change interval that includes zero leaves no clear direction established at that level; use the product’s verdict rather than judging significance from the size or color of a number alone.
Where the unit is **Points** or **pts**, it means percentage points for these percentage metrics. A move from 20% to 25% is a five-point increase.
When IQRush identifies a significant change, consider its practical size and inspect the supporting evidence before choosing an action. Statistical significance and business importance are separate questions.
Review rank changes separately. Other sources can move too, so rank and share do not have to move together.
**Grounded mentions** shows the share of mentions linked to a website reference in the latest run. It is different from mention coverage, which describes how widely a name appears across responses.
## Inspect the detail
* Use the time-series chart to follow the selected result.
* Switch between **Date** and **Run** to change the horizontal view.
* Select a series to inspect its interval.
* In **Top movers**, review **Biggest risers** and **Biggest decliners**. Use **Show** and search to narrow the table.
* Check **Run comparison** for the source, change, confidence interval, and signal.
A source that appears in one run and not another is different from a source measured in both. Follow the page’s presence or comparison message; do not invent a percentage for a missing value.
## After you publish a change
Compare a later completed run with an appropriate earlier run. A change after publication can be useful evidence, but the chart alone does not establish that your publication caused it.
## Ask about change
“What changed between the latest two completed runs? Include the confidence intervals and change assessment.”
Use Agent Q or connected ChatGPT or Claude. Name the two runs if you want a different comparison. See more [questions and reports](/guides/31-questions-and-reports).
**Next:** [Find stronger and weaker contexts](/guides/12-factor-diagnostics), or [review recommendation outcomes](/guides/22-complete-recommendations).
This documentation is built and hosted on [Mintlify](https://mintlify.com), a developer documentation platform.
## Compare the same thing
1. Select the run you want to review in **Runs**.
2. Set **Platform**, **Topic**, **Intent**, and **Prompt type**.
3. Select the **Metric** and, where available, **Domains** or **URLs**.
4. Check the comparison dates shown on the page.
5. In **Run comparison**, use **Reference** to choose the run you want to compare against.
Keep the metric, filters, and project scope consistent when discussing a change with someone else. Check the dates printed above the headline cards separately from the **Reference** selected for **Run comparison**; the reference selector controls its comparison and the movers, rather than resetting the whole history chart.
Before drawing a strong conclusion, check the relevant runs’ **Results stability** in Citations. A comparison between completed runs still needs enough evidence and precision for the decision you intend to make.
## Read the result
The **Metric change** card shows the difference and an assessment such as **No significant change**. A minus sign does not automatically mean a meaningful decline, just as a plus sign does not automatically mean a meaningful gain.
For example, the Colorescience screenshot shows a small decrease in citation share alongside **No significant change**. The measured decrease is not established as a clear change beyond uncertainty in that comparison. This does not prove the result stayed exactly the same.
**Confidence intervals are essential to this judgment.** AI answers vary, so the difference between two point estimates can be noise. Read the **95% CI** on the change where shown, together with the page’s assessment. A change interval that includes zero leaves no clear direction established at that level; use the product’s verdict rather than judging significance from the size or color of a number alone.
Where the unit is **Points** or **pts**, it means percentage points for these percentage metrics. A move from 20% to 25% is a five-point increase.
When IQRush identifies a significant change, consider its practical size and inspect the supporting evidence before choosing an action. Statistical significance and business importance are separate questions.
Review rank changes separately. Other sources can move too, so rank and share do not have to move together.
**Grounded mentions** shows the share of mentions linked to a website reference in the latest run. It is different from mention coverage, which describes how widely a name appears across responses.
## Inspect the detail
* Use the time-series chart to follow the selected result.
* Switch between **Date** and **Run** to change the horizontal view.
* Select a series to inspect its interval.
* In **Top movers**, review **Biggest risers** and **Biggest decliners**. Use **Show** and search to narrow the table.
* Check **Run comparison** for the source, change, confidence interval, and signal.
A source that appears in one run and not another is different from a source measured in both. Follow the page’s presence or comparison message; do not invent a percentage for a missing value.
## After you publish a change
Compare a later completed run with an appropriate earlier run. A change after publication can be useful evidence, but the chart alone does not establish that your publication caused it.
## Ask about change
“What changed between the latest two completed runs? Include the confidence intervals and change assessment.”
Use Agent Q or connected ChatGPT or Claude. Name the two runs if you want a different comparison. See more [questions and reports](/guides/31-questions-and-reports).
**Next:** [Find stronger and weaker contexts](/guides/12-factor-diagnostics), or [review recommendation outcomes](/guides/22-complete-recommendations).
This documentation is built and hosted on [Mintlify](https://mintlify.com), a developer documentation platform.