> ## Documentation Index
> Fetch the complete documentation index at: https://docs.iqrush.ai/llms.txt
> Use this file to discover all available pages before exploring further.
# Compare your position in a run
> Open Analytics → Distribution analysis to see your position in one run.
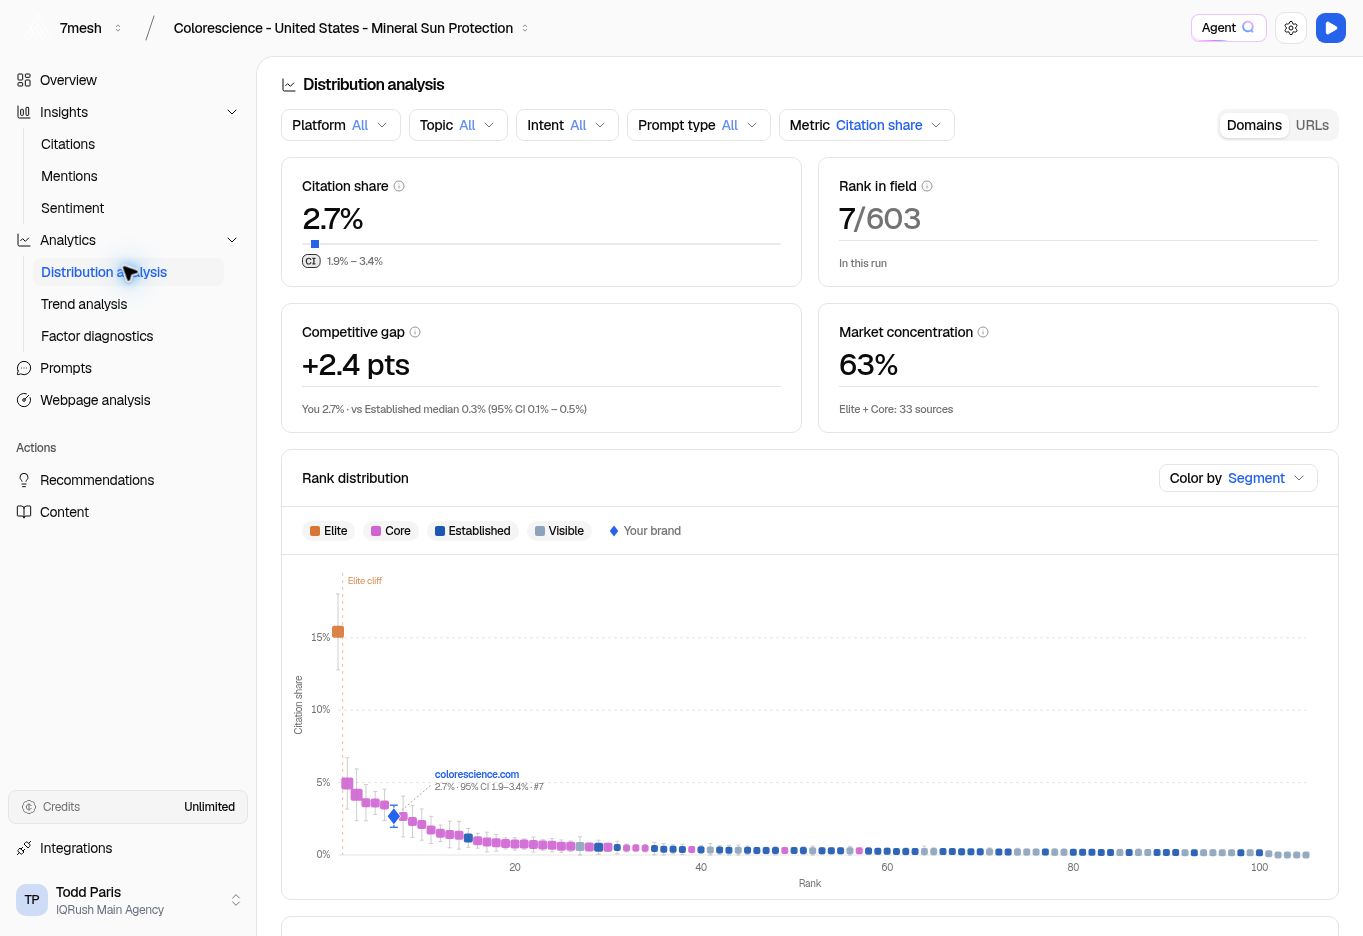
Open **Analytics → Distribution analysis** to see your position in one run. Citation metrics compare websites or pages; **Mention coverage** compares mentioned entities.
 ## Set the comparison
1. Check the run selected in **Runs**.
2. Set **Platform**, **Topic**, **Intent**, and **Prompt type** as needed.
3. Choose a **Metric**.
4. Choose **Domains** to compare websites or **URLs** to compare individual pages, where available.
Some measures do not support both views. A disabled option does not mean data has been lost; use the scope available for that measure.
## Read the cards
| Card | What to look for |
| - | - |
| The selected metric | Your result and its confidence interval. |
| **Rank in field** | Your position among the measured sources or entities for the selected metric. Tied values can share a rank. |
| **Competitive gap** | Your difference from the comparison named beneath the number. |
| **Market concentration** | How much of the measured activity is concentrated in the groups named beneath the card. This is not a market-share or website-traffic estimate. |
Read the comparison label under **Competitive gap**. It may refer to a group median rather than the top competitor or the entire market.
## Explore the ranking
Use **Color by** to change how the chart groups sources. The legend controls let you show or hide the displayed segments. Your brand is marked separately.
Below the chart, the leaderboard gives you a row-by-row view. Use **Search by source**, sorting, and page controls to find a website. Review its metric and interval together.
The labels **Elite**, **Core**, **Established**, and **Visible** describe groups in the displayed source distribution. They are not grades for your business or your writing.
## Keep the conclusion specific
A rank describes this run, its metric, and its filters. Check **Results stability** in Citations before treating the source ordering as settled, then read each metric’s confidence interval. Close ranks do not automatically establish a clear difference. A change in rank alone does not tell you whether the underlying result changed meaningfully. Use Trend analysis when the question is about movement over time.
**Next:** [Compare runs](/guides/11-trends).
This documentation is built and hosted on [Mintlify](https://mintlify.com), a developer documentation platform.
## Set the comparison
1. Check the run selected in **Runs**.
2. Set **Platform**, **Topic**, **Intent**, and **Prompt type** as needed.
3. Choose a **Metric**.
4. Choose **Domains** to compare websites or **URLs** to compare individual pages, where available.
Some measures do not support both views. A disabled option does not mean data has been lost; use the scope available for that measure.
## Read the cards
| Card | What to look for |
| - | - |
| The selected metric | Your result and its confidence interval. |
| **Rank in field** | Your position among the measured sources or entities for the selected metric. Tied values can share a rank. |
| **Competitive gap** | Your difference from the comparison named beneath the number. |
| **Market concentration** | How much of the measured activity is concentrated in the groups named beneath the card. This is not a market-share or website-traffic estimate. |
Read the comparison label under **Competitive gap**. It may refer to a group median rather than the top competitor or the entire market.
## Explore the ranking
Use **Color by** to change how the chart groups sources. The legend controls let you show or hide the displayed segments. Your brand is marked separately.
Below the chart, the leaderboard gives you a row-by-row view. Use **Search by source**, sorting, and page controls to find a website. Review its metric and interval together.
The labels **Elite**, **Core**, **Established**, and **Visible** describe groups in the displayed source distribution. They are not grades for your business or your writing.
## Keep the conclusion specific
A rank describes this run, its metric, and its filters. Check **Results stability** in Citations before treating the source ordering as settled, then read each metric’s confidence interval. Close ranks do not automatically establish a clear difference. A change in rank alone does not tell you whether the underlying result changed meaningfully. Use Trend analysis when the question is about movement over time.
**Next:** [Compare runs](/guides/11-trends).
This documentation is built and hosted on [Mintlify](https://mintlify.com), a developer documentation platform.